Mid-2022 Las Vegas Office Market Report
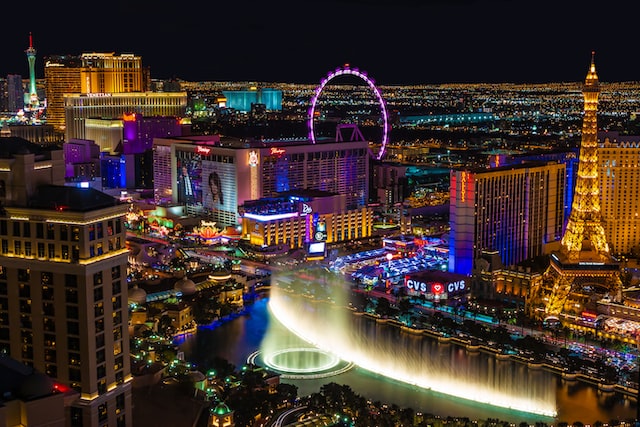 The Las Vegas commercial real estate (CRE) market has continued its recovery and stabilization since emerging from the pandemic. Positive signs for Q2 2022 include reduction in vacancies, positive net absorption, increased asking rents, and the delivery of two projects adding 188,909 square feet (sq/ft) office space to the market.
Strong pre-leasing and inquiry numbers for planned and under-construction projects, along with a rise in companies looking to the Las Vegas Valley to expand or relocate operations entirely, round out the positive sentiment currently seen in the market.
For office product in particular, Las Vegas saw a Q2 of mixed results. On the back of some notable expansion in Q1 2022, Southern NV’s office market has appeared to cool at mid-year. Investment prices reached record levels, however, vacancy rates edged higher. The Southwest submarket continues to see rising rents and additional leasing activity as tenants continue to funnel to this historically popular region.
There are currently 4,660 CRE spaces for lease in Las Vegas, amounting to 41.5 million square feet of space. Out of the 1280 commercial buildings available for sale, 505 have been leased in the past month, with 12 new listings coming onto market at time of print.
Contents
- 1 Key Takeaways
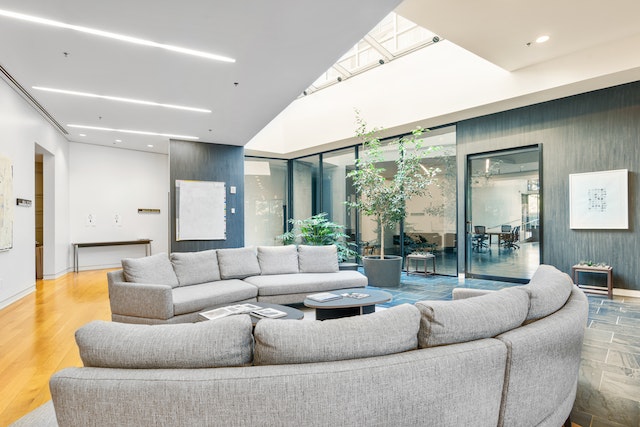
- 2 Mid-2022 Las Vegas Office Space Market – By Class
- 3 Demand for Office Space in Las Vegas
- 4 Las Vegas Commercial Property Construction
- 5 Average Office Rental Costs in Las Vegas
- 6 Office Purchases in Las Vegas
- 7 Las Vegas Commercial Vacancy Rates
- 8 Las Vegas Office Space Take-up Levels
- 9 Coworking Space in Las Vegas
- 10 Las Vegas’ Viability for Conducting Business
- 11 Las Vegas’s Employment Figures and Other Economic Markers
- 12 Outlook for the Las Vegas Office Space Market
Key Takeaways
- Total inventory under construction – 468,400 square feet
- Overall vacancy – 12.7% (a rise from 12.5% in Q1)
- Net absorption – negative 284,323 square feet
- Availability – 6.2 million square feet
- Average asking rents – $28.50 per square foot per year (a decline of $0.02 from Q1)
- Investment sales – $50.5 million (down from $75.5 million in Q1)
Mid-2022 Las Vegas Office Space Market – By Class
Class A
- Inventory – 7.07 million sq/ft
- Availability – 24.8%
- Total vacancy – 22.5% (down from 23.9% in Q1)
- Net absorption – +163,950 sq/ft
- YTD net absorption – +213,393 sq/ft
- Under construction – 620,850 sq/ft
- Average asking rents – $2.80 (Full Service Gross per month)
Class B
- Inventory – 18.77 million sq/ft
- Availability – 15.7%
- Total vacancy – 14.0% (up from 12.5% in Q1)
- Net absorption – negative 282,270 sq/ft
- YTD net absorption – negative 151,415 sq/ft
- Under construction – 41,270 sq/ft
- Average asking rents – $2.34 (FSG per month)
Class C
- Inventory – 20.20 million sq/ft
- Availability – 8.3%
- Total vacancy – 8.0% (down from 8.6% in Q1)
- Net absorption – +163,770 sq/ft
- YTD net absorption – +290,570 sq/ft
- Under construction – 0
- Average asking rents – $2.02 (FSG per month)
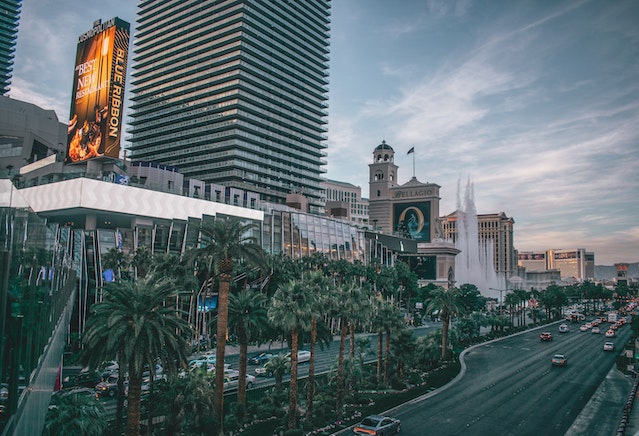
Demand for Office Space in Las Vegas
In Q2 2022, absorption totals were up in four submarkets, with the Southwest (185,076 sq/ft), Downtown (27,482 sq/ft), Central East (18,219 sq/ft), and West (1,503 sq/ft) markets among them.
The absorption rate highs seen in the first half of 2022 are largely driven by the building project UnCommons Phase I, which counts Draft Kings, Morgan Stanley, CBRE, BDO and Sotheby’s International Realty as tenants in buildings one and two. Subleasing activity, however, begins to decline compared to levels seen in 2021, as tenants across the market re-evaluate their workspace needs.
As of Q2 2022, sublease vacancy was 0.84%, or 319,867 sq/ft, versus 0.82% (306,227 sq/ft) a year ago. The Las Vegas market is well positioned to fill the office space void as major companies look to decentralize from major metros – because it contains projects in the development pipeline and has available sublease space with attractive pricing.
Las Vegas Commercial Property Construction
Currently, six properties totaling 636,219 sq/ft are under construction in the Las Vegas office market. All of these developments were speculative, meaning they had not been fully leased or sold prior to being built. They are located proportionally in the Southwest (54%), West (42%) and South (4%) submarkets.
As of Q2 2022, 26% of these projects have been pre-leased. In addition, there are several more office projects in the pipeline that are highly anticipated. This includes UnCommons Phase II, Narrative, and Evora; which will add a combined 345,000 sq/ft of Class A office space to Southern Nevada’s market – specifically in the SW submarket.
In addition, there are 20 planned projects totaling 1.3 million sq/ft of Class A and B office space. Tenants and landlords continue their preference for historical hotspots, searching for space in the South and Southwest submarkets, with 53% of the planned inventory expected to release in these areas.
Average Office Rental Costs in Las Vegas
Average asking rents for all classes of office space increased by $0.23, or 90 bps, over last quarter, but decreased by $0.02 (10 bps) from this time last year. They have settled at $25.54 per sq/ft when annual full-service is accounted for.
Class A asking rents increased 0.3% YOY in Q2 2022, to $32.81 per sq/ft, while Class B asking rents rose 1.1%, to $25.52 per sq/ft. Despite the average rent for Las Vegas falling 1.7% YOY, the Southwest submarket continues to command the highest rental rate at $28.60 per year for all building classes, due to its localized 4.1% increase YOY. The Southwest’s healthy figures are closely followed by the Downtown submarket, featuring average rents of $28.19 per sq/ft.
The Downtown submarket, which had the highest average asking price a year ago at $28.68 per sq/ft per year, has now passed the torch to the Southwest submarket. As an example of this shift, the two major landlords in the Downtown submarket just reduced their rental prices by $3.60 per sq/ft per year.
The weighted average asking rental rate for office space in Southern Nevada rose to $2.37 per sq/ft full service gross in Q2, up $0.14 from one year ago. This quarter’s rise brought the asking rents to their highest level yet recorded. The Southwest was the most expensive submarket, with an average asking rate of $2.74 per sq/ft full service gross. West Central was the least expensive area in Southern Nevada.

Office Purchases in Las Vegas
Q2 2022 office investments in Las Vegas saw $358.7 million in sales volume, with an average price of $308.15 per sq/ft and a 7.2% cap rate. This was less active than Q1 investment-wise, but still strong overall.
On the other hand, this quarter’s user sales saw an improvement from last quarter. In the second quarter of 2022, there were 43 sales with a total volume of $74.1 million and an average sale price of $265.60. The size of office space sold in Q2 totaled 279,120 sq/ft. User sales during this time shifted towards smaller office buildings than usual.
Some notable acquisitions in Q2 2022 include two properties located in the Northwest submarket. The first, acquired by Great Falls Investment Group, was 85,700 sq/ft of prime office space purchased for $30 million (equating to $350 per sq/ft). The second sale was made by Gian Starita, who purchased 35,590 sq/ft for $6 million.
Other notable sales include 32,700 sq/ft located in Las Vegas’s South submarket, which sold for $9.8 million, and a 31,100 sq/ft property in the West, which sold for $6.5 million. Capping off major transactions for Q2, 15,700 sq/ft situated in the Southwest changed hands for $3 million.
Las Vegas Commercial Vacancy Rates
The overall CRE vacancy rate in Las Vegas dropped 80 basis points to 10.9% in Q2 2022, compared to Q1, which represents a reduction of more than 200 bps YOY.
The office product vacancy rate, including sublease space, increased by 70 basis points YOY to 12.5% in Q2 2022. Despite this YOY increase, Q2 saw a 10 basis point decrease from Q1. The current vacancy rate is 50 bps higher than the five-year quarterly average of 12%. Out of all the submarkets, Central North has the lowest vacancy rate at 1.1%. On the other hand, Downtown (15%) and Central East (20.2%) have relatively high vacancy rates compared to the other submarkets.
Current top performers for high desirability – as expressed by their low vacancy rates – include the Northwest submarket, with just 2.6% vacancy for its total office inventory of 5.33million sq/ft, and the Southwest and West submarkets, with tied vacancy rates of just 3.4%, out of their inventories of 6.63million sq/ft and 7.97million sq/ft respectively.
Las Vegas Office Space Take-up Levels
In the second quarter of 2022, tenants in Las Vegas leased a combined 333,490 sq/ft of new office space across 54 deals. This is a decrease from the first quarter of 2022, when 358,685 sq/ft were leased (79 transactions), and from the second quarter of 2021, when 602,507 sq/ft were leased (76 transactions).
This activity indicates that there will be increased absorption in Las Vegas as tenants occupy their space over the next 12 months. The majority of space leased in Q1 2022 was in the South submarket (105,718 sq/ft, or 32%), followed by the Central East (25%) and West (16%) submarkets.
Out of all newly leased space, Class A leases had the biggest share at 50% (166,293 sq/ft), with Class B close behind at 41% (137,070 sq/ft). Lastly, 9% was from Class C (30.127 sq/ft).

Coworking Space in Las Vegas
3 million people currently call the state of Nevada home, however, prior to the pandemic, 41 million people visited the city of Las Vegas every year.
The local coworking and flexible office space market is predicted to regain prominence over the course of the next 12 months, as tourism and business travel continued to recover to pre-pandemic levels.
Indicative of its continued status as a premiere location to combine work and pleasure, the entertainment capital of the world recently took the title of North America’s Leading Meetings and Conference Destination at the World Travel Awards.
The desert city experienced its busiest month ever in June 2022, with record air arrivals of 4.68 million visitors – a 23% increase YOY. Not since October 2019 has Las Vegas experienced such a record-setting month for traveler influx, when it saw 4.61 million visitors. Late 2019 was also a more innocent time in regard to potential global pandemics, making it particularly impressive to see records broken considering the events of 2020 and 2021. It’s clear to see that Las Vegas is once again open for business.
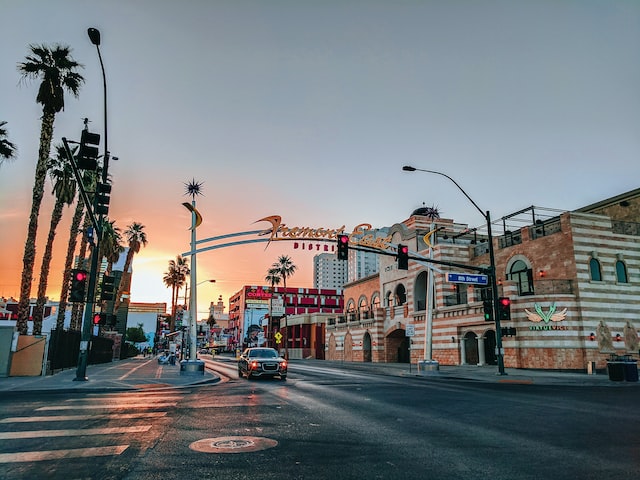
Las Vegas’ Viability for Conducting Business
The Las Vegas economy has rapidly blossomed over the last three decades, despite pandemic-related speed bumps, with above-average population growth and significant development typifying the market. The city has a track record of weathering economic volatility, surviving a severe housing recession in 2008.
The tax assessed value (TAV) of properties in Las Vegas decreased more than 50% from 2009 to 2014, but has increased 89% in the past seven years. It still, however, remains about 10% lower than the prior peak valuation. Home prices have grown rapidly recently – including a 19% YOY increase in 2021 – because of things like low mortgage rates and heightened demand for homeownership during pandemic times.
The poverty rate in Las Vegas is relatively high and incomes are low compared to national averages, which reflects the below-average educational achievement and dependence on service-based tourism seen throughout the city.
Though Nevada’s tourism and gaming industries are synonymous with Las Vegas, most of the top, well-known casinos and hotels are actually located outside the city limits in unincorporated Clark County, the actual home to much of the state’s gaming and tourism business. “The Strip” is located in unincorporated Clark County on Las Vegas Boulevard, however, the city still benefits from the tourist attractions and conferences held there.
Companies based in Nevada can save millions of dollars in the long-term by taking advantage of the state’s low taxes. This positive taxation climate is a big reason why many businesses see the Las Vegas Valley as an enterprise-friendly option for expanding, or outright relocating, their operations.
All in all, Las Vegas is an excellent location to start a business. It’s especially ideal for entrepreneurs and firms looking for places requiring less initial funding. When it comes to business, this desert city has inexpensive services, low real estate prices, low taxes, a willing workforce, and all the benefits associated with living in a global entertainment hub. Additionally, Nevada is ranked second in the U.S. for encouraging small business operations.
Las Vegas has Several Tax Breaks Conducive to Business Enterprise
- No franchise tax
- No personal income tax
- No business income tax
- No gift tax
Las Vegas’s Employment Figures and Other Economic Markers
Las Vegas is Nevada’s largest city, with a population of around 655,000. The city is part of the Las Vegas Valley, which has 2.3 million people and includes the renowned Las Vegas Strip. The local economy is fueled by tourism, with key employers linked to the entertainment, gaming, or convention industries.
The hospitality and leisure industry took a severe hit when the pandemic started. According to the Bureau of Labor Statistics, employment figures plummeted from nearly 300,000 residents in March 2020 to 127,000 during April and May while shelter-in place orders were at their most strict.
As of March 2022, the hospitality and leisure industry reports employing 268,000 residents. This is a 111% increase from the pandemic low; however, it is still only 89% of pre-pandemic employment levels.
Independent financial analysts are mostly unanimous in their expectation, however, that the hospitality industry will grow faster than employment as a whole in the next few quarters, because people are starting to use face-to-face services again, en masse.
Steering away from the hospitality and tourism economic dominance, Las Vegas is ranked #5 in the United States for new STEM graduates, and #3 for lowest student loan debt. These factors could hint instead to its possible near-term viability as an emergent tech hub.
Non-farm employment increased by 83,300 jobs or +8.6% YOY from May 2021 through May 2022, with the service producing sector accounting for 83,760 jobs created (+9.7% YOY), while leisure and hospitality added 35,860 jobs (+15.4%) YOY.
While the monthly unemployment rate in Las Vegas has slowly decreased from 9.0% last year to 5.5% currently, it remains 190 bps higher than the U.S. overall unemployment rate of 3.6%. All employment sectors are predicted to expand at a joint rate of 9.1% in 2022, with construction and manufacturing leading the pack at 8.8% and 6% respectively.
Between May 2021 and May 2022, Southern Nevada’s office job market increased by 24,000 jobs, according to figures from DETR (the Department of Employment, Training and Rehabilitation). Over the course of 12 months ending May 2022, total employment throughout Southern Nevada increased by 87,100 jobs, equivalent to 3% growth.
Las Vegas is projected to have a 4.2% growth in its economy by the end of 2022, when compared to 2021’s Gross Regional Product of $106.4 billion. This is forecasted to rise 6.2% in 2023, which surpasses the average 10-year growth rate of 18% for the region.
Las Vegas is currently projected to have a 4.2% growth in its economy by the end of 2022, backed up by a 6.2% rise in 2023. These growth rates are based on a local economy of $06.4 billion based on 2021 Gross Regional Product.
Outlook for the Las Vegas Office Space Market
Credit rating entities have indicated the outlook for Las Vegas has improved by one notch, from Stable to Positive. This change reflects the city’s quick recovery, as demonstrated by encouraging visitor patterns and projected revenue growth that is expected to continue for the foreseeable future.
This positive outlook suggests that the rating may be upgraded in one to two years; nevertheless, it does not imply a rating change is guaranteed. The pandemic has introduced uncertainty about the city’s economic comeback. It’s expected that further positive changes in the hotel and tourism industries will be determined by how quickly business travel completely resumes, which won’t fully recover to pre-pandemic levels until at least 2024.
The recent surge in prices might put pressure on the city’s labor costs, and restrict discretionary spending on travel and entertainment, but present trends suggest that this is an indication of a continuing trend of improvement. It is anticipated that Las Vegas is well positioned to continue addressing the strains of ongoing recovery, especially based on positive strides displayed up to this point in time.
In the first quarter of 2022, the U.S. experienced negative GDP growth, suggesting that the economy is now in a recession. While it would be presumptive to claim that Southern Nevada is “recession-proof,” it is worth noting that Southern Nevada has yet to fully recover from its 2020 lockdowns, and may continue to recover even as the national economy slows down.
It’s expected that the Southern Nevada office market will have strong net absorption by the end of 2022, however there will be more vacant space. This is because the Valley’s office inventory is expected to grow by 382,109 sq/ft over the year. While this space is 41% pre-leased, representing future net absorption, it will add up to 225,000 sq/ft of vacant real estate to the market.
Four of the commercial buildings now under construction are scheduled to complete by the end of 2022, bringing 450,000 sq/ft of space to the Southern Nevada office market. 36% of this space is currently pre-leased. It’s anticipated that pre-leasing activity will improve as these four properties approach completion, which will boost occupancy figures for the year overall.
Further Insights
Looking for more commercial property market research reports? Click here for our recent post outlining the state of the market in Atlanta, or here for our Houston report. You can also keep an eye on our Facebook and Twitter for more market reports. If you’re looking for office space of your own, you can visit our Las Vegas page or call us to have a discussion about your requirements on 972-913-2742.
You can also find a range of additional articles below:
Coworking Space for Students on U.S. College Campuses
How the Decentralization of Cities Has Changed the U.S. Office Space Market
US Office Market Trends 2022 – Statistics, Challenges and Outlook
January 2022 – U.S. National Office Market Report
The Great Resignation or the Great Retention? How Employers Yield the Power Heading into 2022
5 Ways to Create a Great Office Culture