Return to Office Trends: Survey of What Employees Really Think
February 6th, 2025
The gradual rollback of remote work arrangements, which were put in place as a short-term fix to keep businesses operating during the height of pandemic lockdowns, has now given rise to one of the most contentious issues in the employment arena. To return to the office, or not to return, that is the question.
Some prominent businesses like Spotify are steadfastly upholding flexible work-from-home policies, stating resoundingly that “remote staff aren’t children.” Other tech giants, however, such as Amazon and iPhone challenger, Nothing, have made U-turns on their previous work-from-home policies, implementing return-to-office policies across the board for all corporate employees.
Taking their lead from the tech heavyweights, return-to-office (RTO) mandates are now widespread for businesses throughout the United States. And with the new administration declaring an RTO mandate for all federal employees of government offices throughout the country, the tide well and truly seems to be shifting against remote, hybrid, and even flexible work schedules.
Drastic Shift: From Widespread Remote Work to Full RTOs
The prestige and dominant market power of big-name tech brands helps ensure they can continue to attract top talent in droves, regardless of any contentious mandates like a full RTO. This will remain true even despite the attrition of former remote hires who were attracted by the flexible work location policies of a few short years ago.
 Overview of USA Office Market
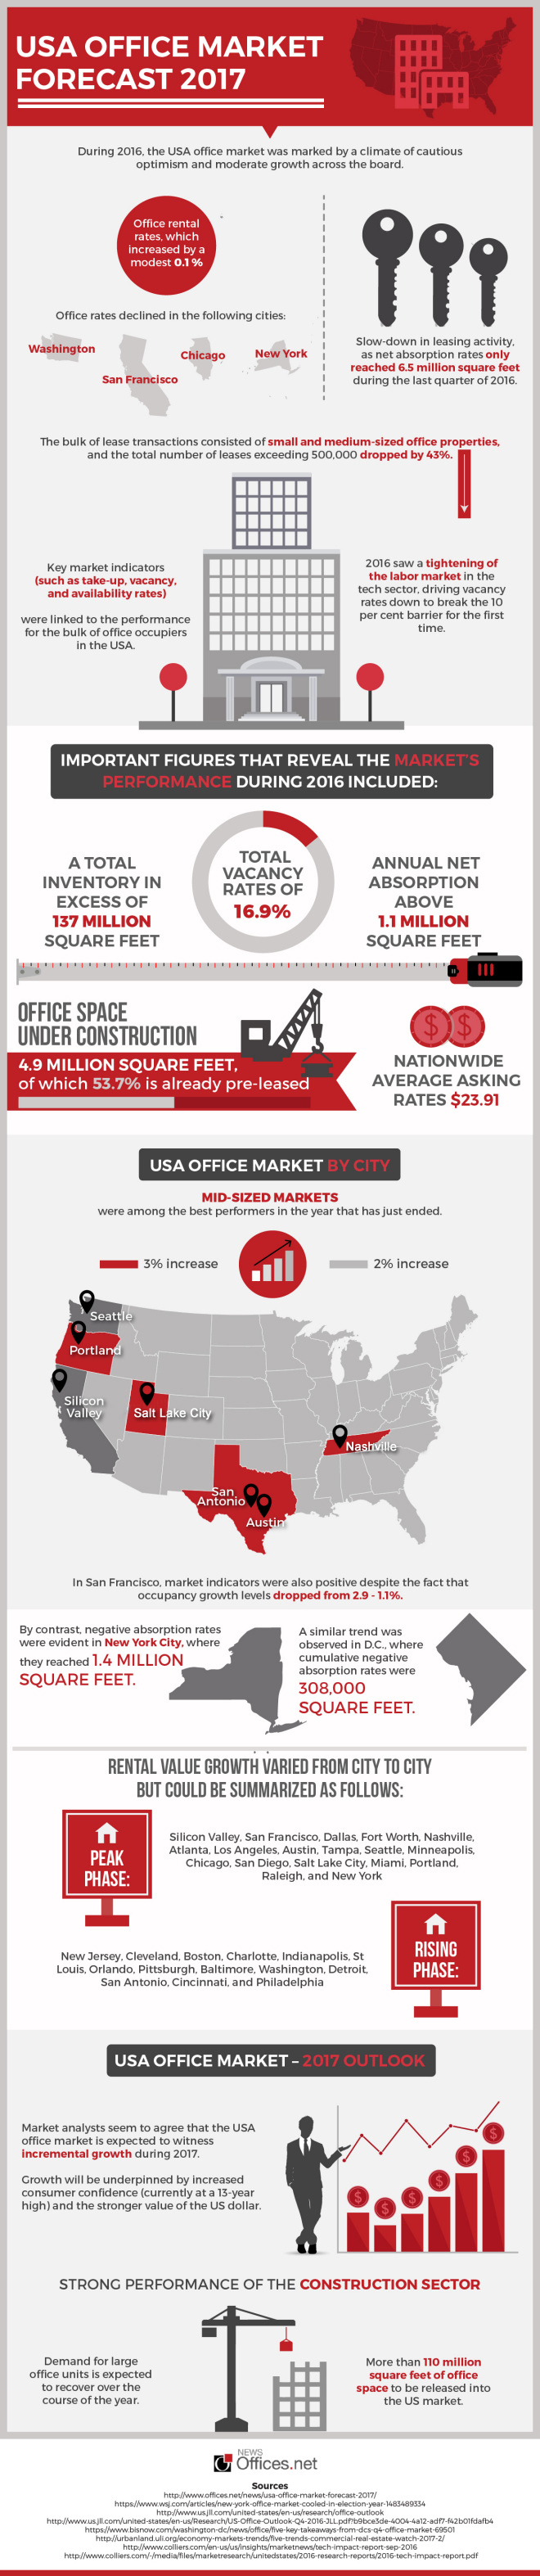
 Bolstered by a robust economic performance, the office market in Washington DC delivered a fine performance throughout 2015. Unemployment levels in the DC metropolitan area were at their lowest since 2008, reaching figures well below the US national average (4.3 per cent vs 5 per cent). These conditions have helped shape a real estate market that is predominantly favourable to landlords, as the following trends demonstrate: