Posts Tagged ‘Office Market Trends’

United States Commercial Property Prices Per Square Foot

February 28th, 2023

Smiling office colleagues conduct a meeting discussing United States commercial property prices per square foot. Three people are seated with their laptops open in front of them on the meeting room table while one woman in a grey top stands at the head of the table addressing her gathered colleagues - Offices.net.

The United States is home to one of the world’s largest commercial real estate markets, with an estimated revenue worth of approximately $1.2tr. In terms of size, industrial space is the largest sub-market with 21.7bn square feet, followed by retail with 14bn, and offices, which account for 11.8bn.

In Q1 2023, the average price per square foot for US offices was just over $38. Retail averaged out to $18.09 / square foot, and industrial space came in at just under $8 / square foot. However, there are significant variations in average prices based on location and real estate class. Here is a summary of average commercial rates in key USA cities:

  •   New York: Average gross rates for metro New York offices are $77 / sq ft / year. Industrial space averages $19 / sq ft / year.
  •   Los Angeles: $44 / sq ft / year for offices in the metropolitan area and $11 / sq ft / year for industrial premises.
  •   Miami: In the same range as Los Angeles, at $46 / sq ft / year for offices and slightly lower for industrial space ($8 / sq ft / year).
  •   Boston: $38/ sq ft / year for metro offices, rising to $80 in Cambridge. Industrial properties average $10 / sq ft / year.
  •   Philadelphia: $32 / sq ft / year for city center offices, $27 for suburban space, and $6 / sq ft / year for industrial properties.
  •   Atlanta: Slightly under $30 / sq ft / year for offices with a rate of $35 in Downtown Atlanta. Industrial space is charged at an average of $5 / sq ft / year.
  •   Chicago: Approximately $33 / sq ft / year for office space, rising to averages above $40 in The Loop. Industrial premises average $6 / sq ft / year.
  •   Dallas and other urban centers in Texas: between $25 and $30 / sq ft / year, whereas industrial rates are below $5.

Read the rest of this entry »

US Office Market Trends 2022 – Statistics, Challenges and Outlook

February 24th, 2022

man looks over u.s. office market trends 2022 report at offices.netThe US office market struggle to get back on its feet for most of 2021, despite the year starting with the expectation that this arm of the commercial real estate market would be on its way to recovery by Q3 to Q4. Ultimately, the emergence of the Delta and Omicron variants of COVID-19 resulted in forecasts being revised, and the recovery horizon was pushed to 2022.

We’ve collected a brief overview of the trends, figures, and projections for the 2022 US office space market below, check back frequently in the year ahead for more insight into industry trends and recovery projections.

Economic Indicators Tipped to Improve

There are many factors influencing office market performance, but macro-economic indicators are some of the most critical. As we settle into 2022, a decline in unemployment is expected to be one of the most important factors underscoring the recovery of the office market. Recent data from the U.S. Bureau of Labor Statistics outlined a small uptick in unemployment in January 2022, moving from 3.9% at the end of 2021 to 4.0% to end the first month of the new year. Read the rest of this entry »

January 2022 – U.S. National Office Market Report

February 11th, 2022

man delivers national office report at offices.net

Notable Office Market Insights

  •  Ongoing recovery is the main theme, continuing the trend seen in most office markets throughout 2021.
  •  Positive absorption indicators.
  •  Slight increase in rental rates.
  •  Marked differences in occupancy levels, vacancy rates and general performance from city to city.
  •  Remote working practices are still commonplace in key markets, such as San Francisco.
  •  142 million square feet of office space currently under construction.

Lease Rates & Asking Rents

Recent data from Commercial Edge outlines a nationwide rental listing rate average of $38sq/ft in January 2022. These figures may be seen as somewhat inflated due to the number of high quality spaces currently listed due to being vacant, with Class A workspaces being listed at much higher prices.

According to Avison Young, Q4 average rental prices per square foot in gateway markets were as follows:

Read the rest of this entry »

United States Office Rental Market – Trends for 2021

January 27th, 2021

Commercial real estate was one of the hardest hit sectors following the coronavirus outbreak in 2020. The pandemic and the measures taken to curb its spread brought significant changes to office-based workplaces, driving a sharp and sudden increase in remote work practices. The most immediate consequence of this shift was a softening in rental activity due to the decreased need for physical office space in the short-term. As a result, 2020 ended with a marked decline in take-up volume and an increase in office vacancy rates across the nation.

The United States office rental market entered the new year in a scenario marked by declining rental rates and compromised fundamentals. As we move further into 2021, these trends are likely to remain in place and some markets may begin to feel the full impact of the economic crisis, whereas others will prove more resilient.

Read the rest of this entry »

United States Commercial Property Prices 2020: Per Square Foot

December 15th, 2020

An updated version of this post can be found by clicking here.

The United States is home to one of the world’s largest commercial real estate markets, with an estimated worth of approximately $950bn. In terms of size, industrial space is the largest sub-market with 21bn square feet, followed by retail with 13bn, and offices, which account for 11bn.

In Q2 2020, the average price per square foot for US offices was just over $35. Retail averaged out to $18.09 / square foot, and industrial space came in at just under $8 / square foot. However, there are significant variations in average prices based on location and real estate class. Here is a summary of average commercial rates in key USA cities:

  •   New York: Average gross rates for metro New York offices are $81 / sq ft / year. Industrial space averages $19 / sq ft / year.
  •   Los Angeles: $44 / sq ft / year for offices in the metropolitan area and $11 / sq ft / year for industrial premises.
  •   Miami: In the same range as Los Angeles for CBD offices and slightly lower for industrial space ($8 / sq ft / year).
  •   Boston: $39/ sq ft / year for metro offices, rising to $80 in Cambridge. Industrial properties average $10 / sq ft / year.
  •   Philadelphia: $36 / sq ft / year for city center offices, $27 for suburban space, and $6 / sq ft / year for industrial properties.
  •   Atlanta: Slightly under $30 / sq ft / year for offices with a rate of $35 in Downtown Atlanta. Industrial space is charged at an average of $5 / sq ft / year.
  •   Chicago: Approximately $33 / sq ft / year for office space, rising to averages above $40 in The Loop. Industrial premises average $6 / sq ft / year.
  •   Dallas and other urban centers in Texas: between $25 and $30 / sq ft / year, whereas industrial rates are below $5.

Read the rest of this entry »

USA Office Market Forecast 2017

February 2nd, 2017

USA Office Buildings offices.netOverview of USA Office Market

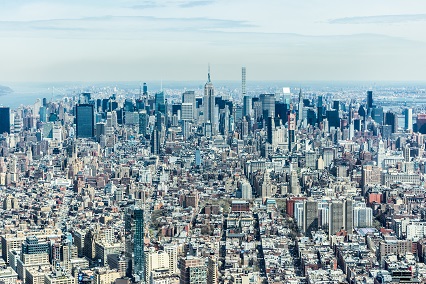
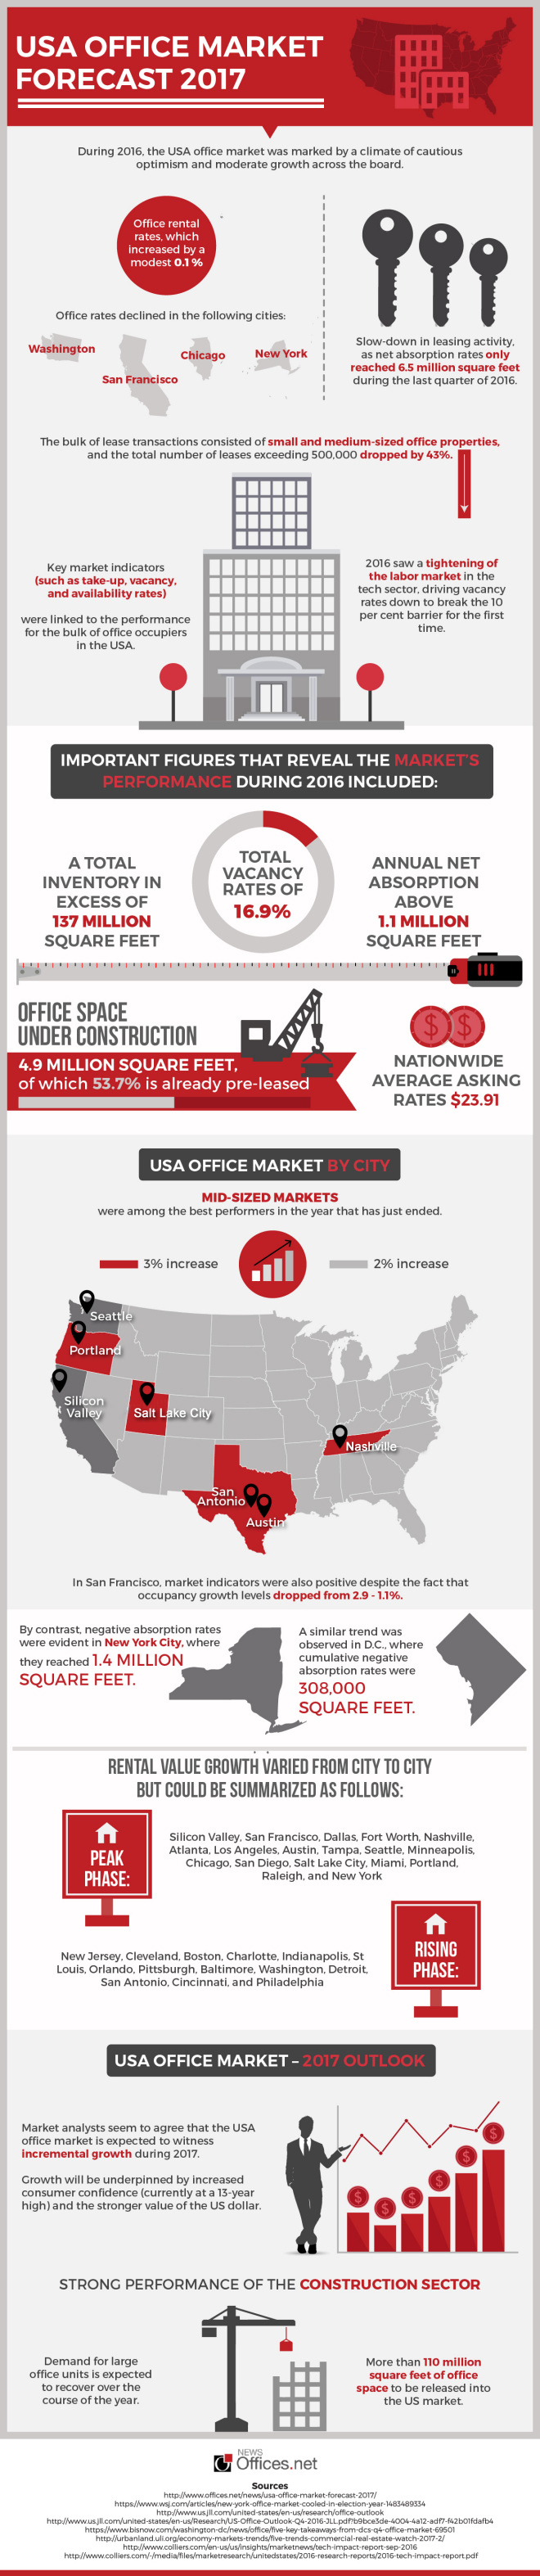
During 2016, the USA office market was marked by a climate of cautious optimism and moderate growth across the board. This was mostly evident in office rental rates, which increased by a modest 0.1 per cent or even declined in cities like Chicago, New York, Washington and San Francisco. This was coupled with a slow-down in leasing activity, as net absorption rates only reached 6.5 million square feet during the last quarter of 2016. The bulk of lease transactions consisted of small and medium-sized office properties, and the total number of leases exceeding 500,000 dropped by 43 per cent.

Key market indicators (such as take-up, vacancy, and availability rates) were linked to the performance of those industry sectors that make up for the bulk of office occupiers in the USA. 2016 saw a tightening of the labor market in the tech sector, driving vacancy rates down to break the 10 per cent barrier for the first time. This offset the relative stagnation in activity coming from occupiers involved in financial services, legal, and government.

Important figures that reveal the market’s performance during 2016 included:

– A total inventory in excess of 137 million square feet

– Total vacancy rates of 16.9 per cent

– Annual net absorption above 1.1 million square feet

– Nationwide average asking rates $23.91

– Office space under construction 4.9 million square feet, of which 53.7 per cent is already pre-leased

USA Office Market Forecast 2017


USA Office Market by City

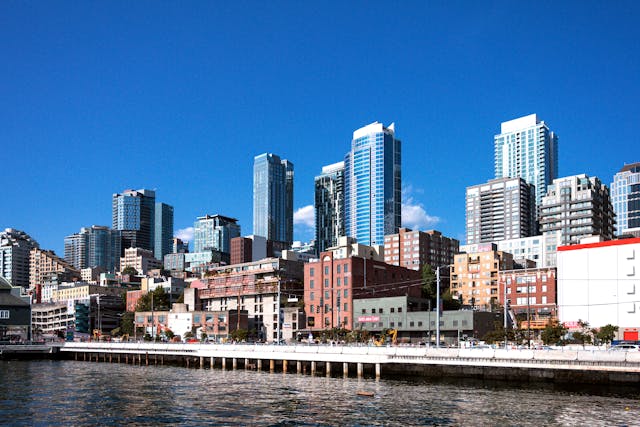
Mid-sized markets were among the best performers in the year that has just ended. Portland, Nashville, Salt Lake City, and San Antonio were characterized by occupancy increases that averaged 3 per cent. In San Francisco, market indicators were also positive despite the fact that occupancy growth levels dropped from 2.9 to 1.1 per cent. Other regional office markets that did well included Austin, Silicon Valley, and Seattle. In these markets, occupancy growth averaged 2 per cent. Read the rest of this entry »

Manhattan Office Market: 2016 Forecast

February 17th, 2016

An in depth look at how the Manhattan office space market has fared in 2015 and forecasts for this coming year.

Manhattan Office Market Overview of 2015

Over the past 12 months, federal economic policy has been focusing on expansion, driving an increase in employment rates, especially as far as office-based employment is concerned. This type of employment grew by 2.6 per cent in just 1 year, and prompted a considerable increase in demand led by occupiers in the Manhattan financial services sector. In certain Manhattan sub-markets (such as in Midtown South), strong demand from tenants in the TAMI sector (technology, advertising, media, and information) was also evident.

At the end of 2015, total office stock in Manhattan was just under 395 million square feet, of which 28 million were vacant. Total transaction volume amounted to more than 28 million square feet, one of the highest figures of the past 10 years. However, there was a slight decline in transaction volumes in downtown Manhattan, where transactions mostly involved small and medium-sized office properties.

Manhattan Office Market: Key Facts & Figures

During 2015, office vacancy rates in Manhattan went down from 9.3 per cent to 8.5 per cent. This decrease equals to 90 basis points on a year-on-year basis, and brings vacancy rates closer to Manhattan’s historical average of 8.9 per cent. In Midtown South, vacancy rates were markedly lower at 6.2 per cent, whereas in downtown Manhattan they went down by 30 basis points to 9.4 per cent. Read the rest of this entry »

San Francisco: Commercial Real Estate, Office Space Trends and Statistics

March 16th, 2015

The city of San Francisco is one of the top business hubs in the Americas. The local business community is among the most vibrant and successful at global level, partly due to the huge pool of talent available in the city and its surrounding areas. A large number of Fortune 500 companies are based in the area, and business opportunities exist for enterprises operating in a wide range of sectors, from aerospace to health care and including electronics, consumer goods, retail, and telecommunications.

The undeniable appeal of San Francisco as a business location has attracted hundreds of prospective entrepreneurs to the area. If you are considering setting up a business in San Francisco, take a look at our detailed guide to commercial property in this thriving Californian city.

Key Trends in the San Francisco CRE Market
For the past two years, the local commercial property market in San Francisco has shown a variety of healthy indicators.
Read the rest of this entry »