Office Features to Look Out for in the Second Half of 2021
June 23rd, 2021 The US office market has been dramatically transformed by the changes to work practices and mobility restrictions implemented throughout the course of 2020 and early 2021. Whilst it was predicted that the market would slowly rebound starting in recent months, the demands of office occupiers will have changed substantially since the start of the COVID-19 pandemic. Below is a brief overview of the main things to look for in an office space during the second half of 2021.
Office Layout
Flexible spaces
Flexibility remains a key consideration when choosing an office, not only in terms of lease terms, but also office layouts. Many office-based companies are still unsure about their ability to retain staff in the face of reduced revenue, combating this uncertainty by implementing rotating shifts or flexible work hours, two factors which have ultimately led to businesses struggling to identify the total headcount in the office at any given time.
This uncertainty will lead to an increase in demand for modular spaces that can be adjusted depending on the number of people present in the workplace. These kinds of dynamic layouts have been an option for several years, often going hand in hand with trends towards multi-functional office spaces. Some of the main elements that typify flexible workspaces include:
- Blurred indoor to outdoor transitions.
- Movable walls and room dividers.
- Lightweight or mobile office furniture.
- Adjustable or movable lighting.
 In a previous blog post we examined the performance of the commercial real estate market in some major US cities. This is the second article in this series, which uses data from late 2020 and early 2021 to examine vacancy and supply rates in cities such as Los Angeles, Chicago, Atlanta and Houston. These statistics illustrate the impact of COVID-19 on the commercial property rental market, as well as the types of properties that are holding strong in the face of negative trends.
 Commercial real estate was one of the hardest hit sectors following the coronavirus outbreak in 2020. The pandemic and the measures taken to curb its spread brought significant changes to office-based workplaces, driving a sharp and sudden increase in remote work practices. The most immediate consequence of this shift was a softening in rental activity due to the decreased need for physical office space in the short-term. As a result, 2020 ended with a marked decline in take-up volume and an increase in office vacancy rates across the nation.
 The United States office market is characterized by its wide range of properties, ranging from affordable shared spaces to expensive trophy offices in some of the world’s most desirable business locations. In mid-2020, average gross rates for offices nationwide stood at $35 per square foot with the
  An updated version of this post can be found by
  Los Angeles County is home to the nation’s second largest metropolitan area and to one of the world’s most powerful economies. The county is made up of 88 cities and has approximately 300,000 employers, which provide jobs to a workforce of nearly 5 million people.
 Louisville is a mid-sized urban center in Boulder County with a population of approximately 20,000 people. The city has a central location within Colorado and is within easy reach of other major cities, with Denver only a 30-minute drive away and
  Overview of USA Office Market
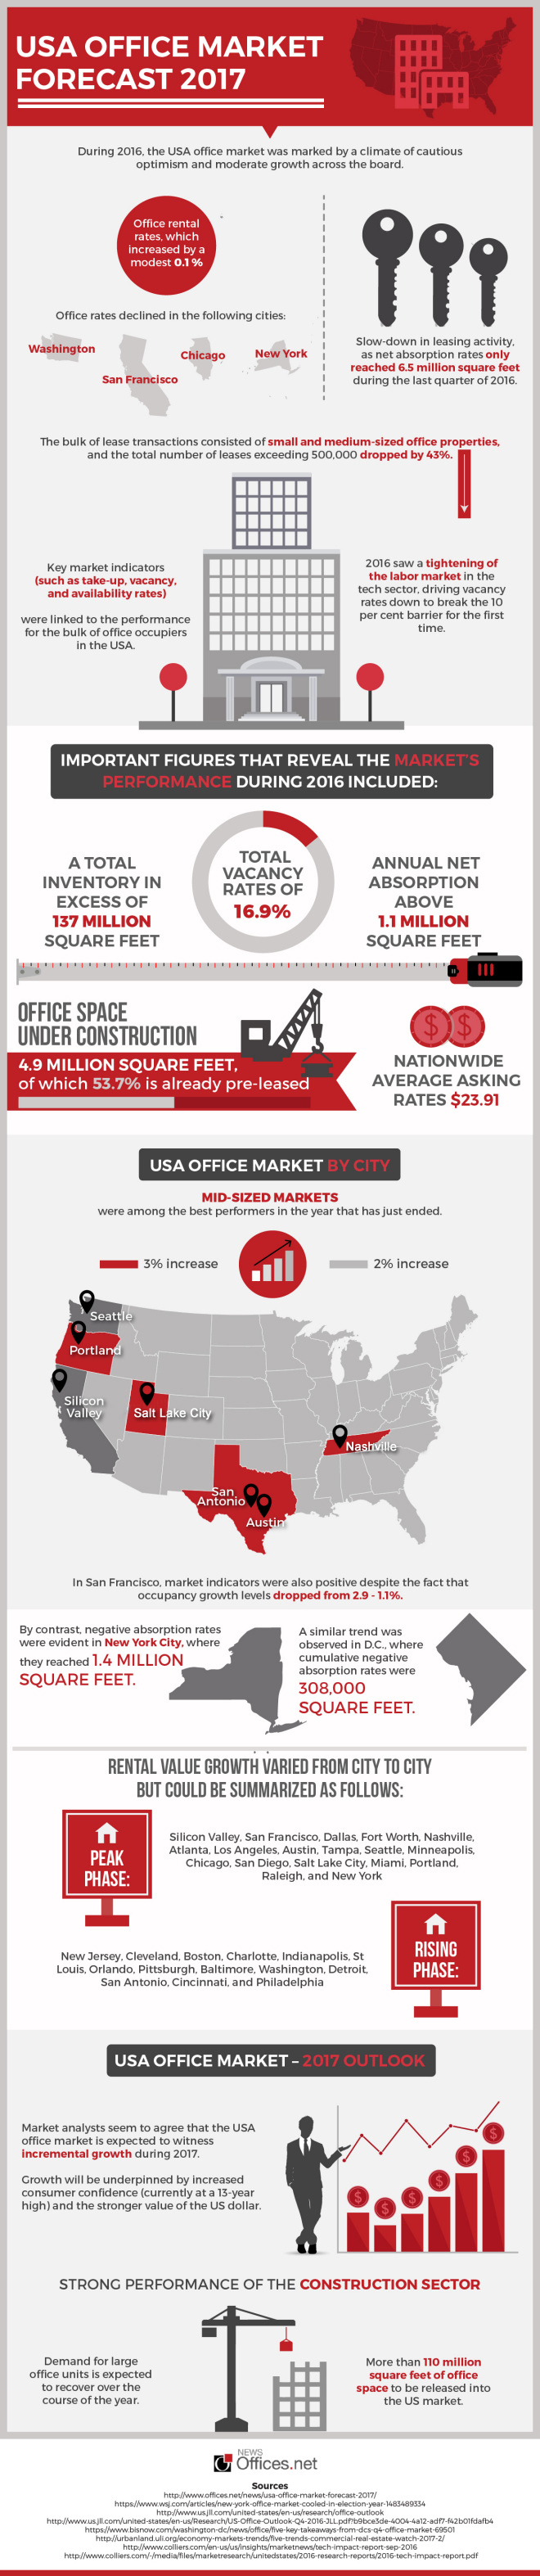
 Bolstered by a robust economic performance, the office market in Washington DC delivered a fine performance throughout 2015. Unemployment levels in the DC metropolitan area were at their lowest since 2008, reaching figures well below the US national average (4.3 per cent vs 5 per cent). These conditions have helped shape a real estate market that is predominantly favourable to landlords, as the following trends demonstrate: